
Urban Heat Island map for Geneva, Brussels, Montreal and Baltimore
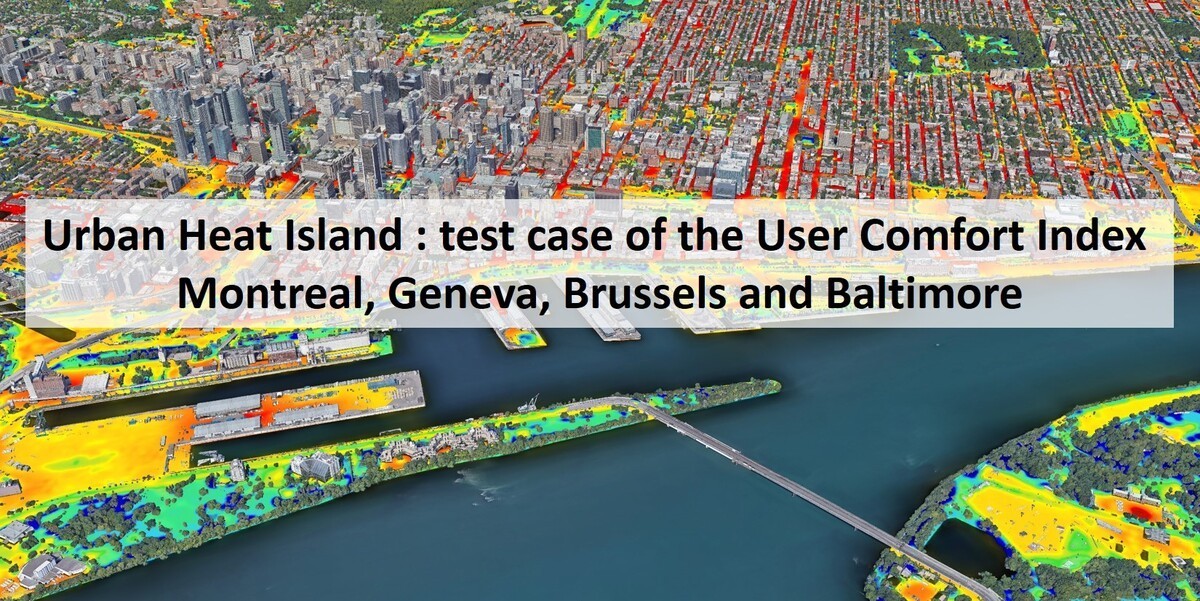
Some different approaches are used to identif UHI as Land Surface Temperature or microclimate simulation … This small study aims to compare or own method, based on the User Comfort Index, with those more classical methods.
We also want to assess that this method, developed on French cities, may be used in other countries. Four cities have been chosen: Montreal (Canada), Geneva (Switzerland), Brussels (Belgium) and Baltimore (USA).
The method
Our main concern was to be able to detect precisely and quickly the UHI on a wide territory with remote sensing. We also wanted to analyse the evolution over weeks and months and to be able to simulate the impact of mitigation projects as greening, albedo…
Our method is based on both a micro-scale approach (models are developed on local monitoring of urbans spaces, vegetal structures …) and a macro-scale (with remote sensing) on the whole territory. It is user-centered, meaning that we are interested in what the user feels.
The User Comfort Index takes into account the capability of an urban space to store the thermic energy during the day and to deliver it during the night, and to dissipate this energy thru evaporation. It is based on morphological parameters:
- Building density (surface and volume)
- Impervious soil density
- Quality of the vegetation : density and drought stress
- Quality of the canopy: density and drought stress
Some of the parameters are close to those used for the LCZ. The impact of vegetation and its drought stress is absolutely necessary to obtain a realistic mapping.
You may read more about the method and application on:
- The Future of Urban Greening: A Study of One Million Trees to Determine the Best Species to Plant
- From territorial diagnosis to simulation of the behavior of revegetation projects and their impact on UH
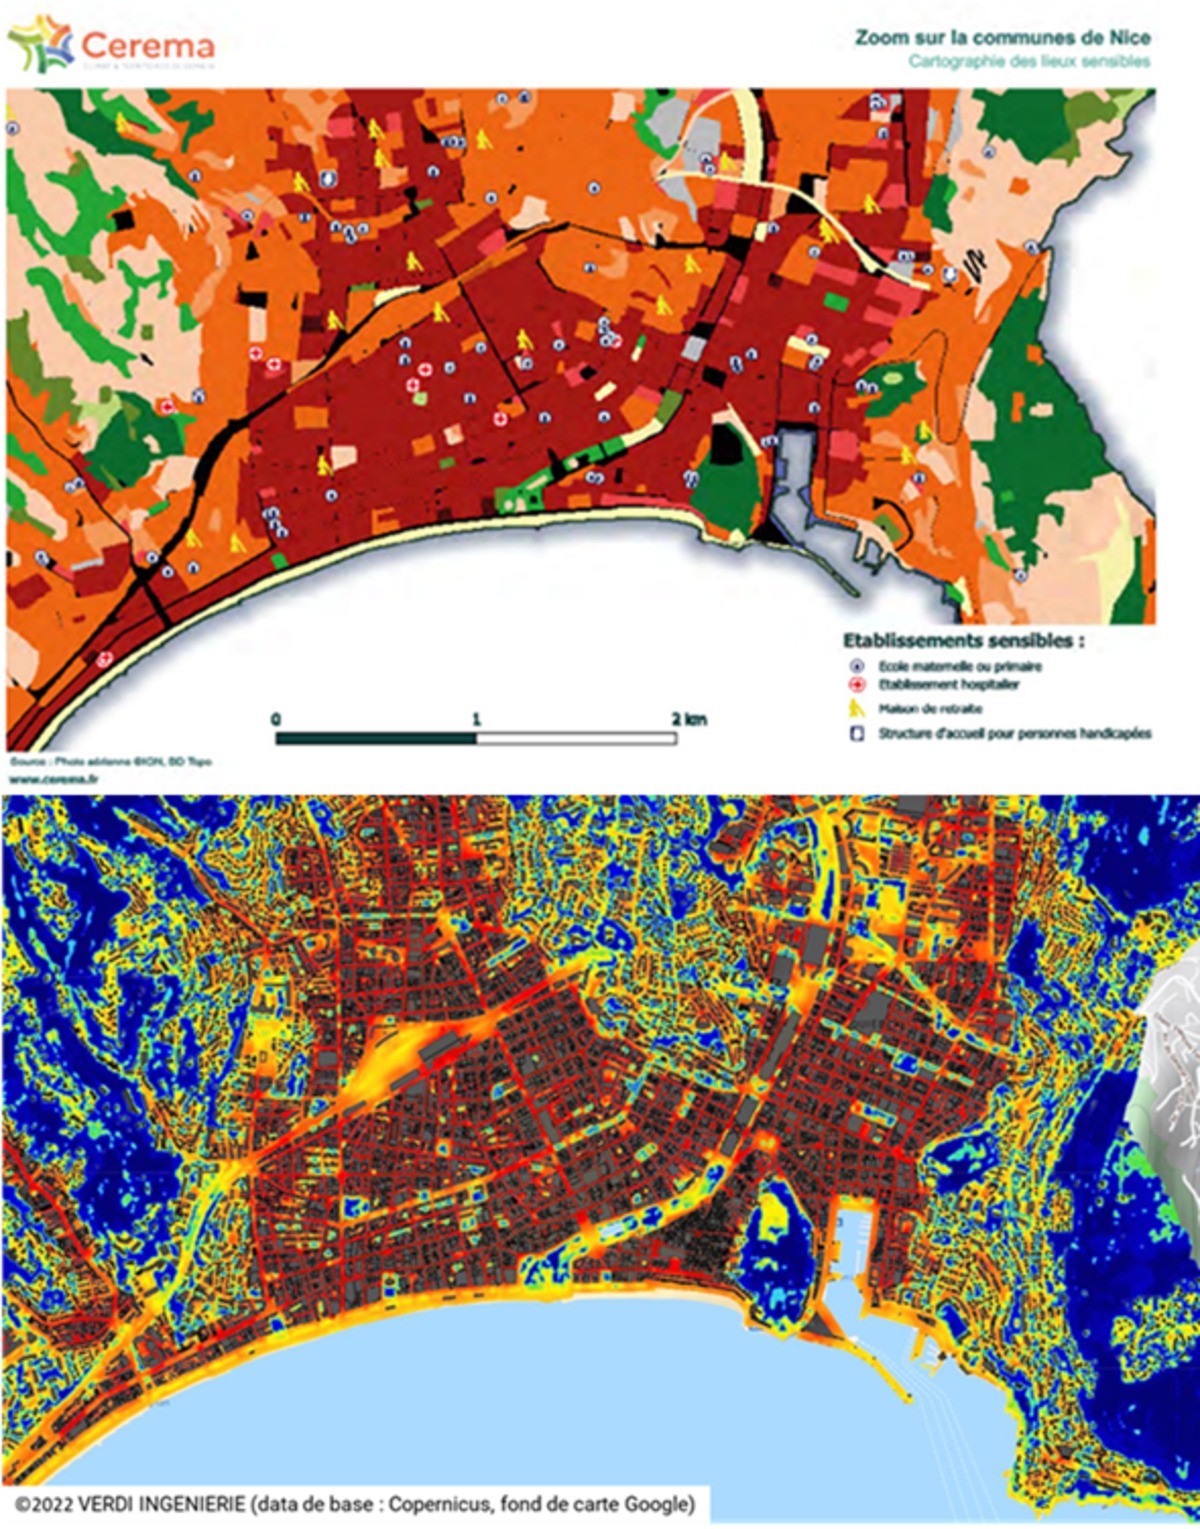
The method was developped in French cities and compared with other methods. This picture shows the comparison of the UHI mapping in the city of Nice (France) between the CEREMA method (on the top) and the User Comfort Index method.
The criteria used in the both method are roughly the same even if the scales and the data differ. As the method takes into account generic parameters, it seemed obvious that it could be used in very every country. Let’s use it on different test cases.
Some test cases: Montreal, Baltimore, Geneva and Brussels
We needed to find cities with available data concerning the cadastre, water bodiesand UHI mapping, whatever the method used to obtain it. We have identified:
- Brussels (Belgium)
- Genève (Switzerland)
- Baltimore (USA)
- Montreal (Canada)
Geneva:
The city of Geneva held a very thorough study (GEO-NET) of UHI you can find here. The method implemented is based on the FITNAH 3D mesoscale model. The comparison with this type of tool is particularly interesting. Based on a priori slightly different cadastres, the images below present a comparison between the SITG results (left) and our own results (right).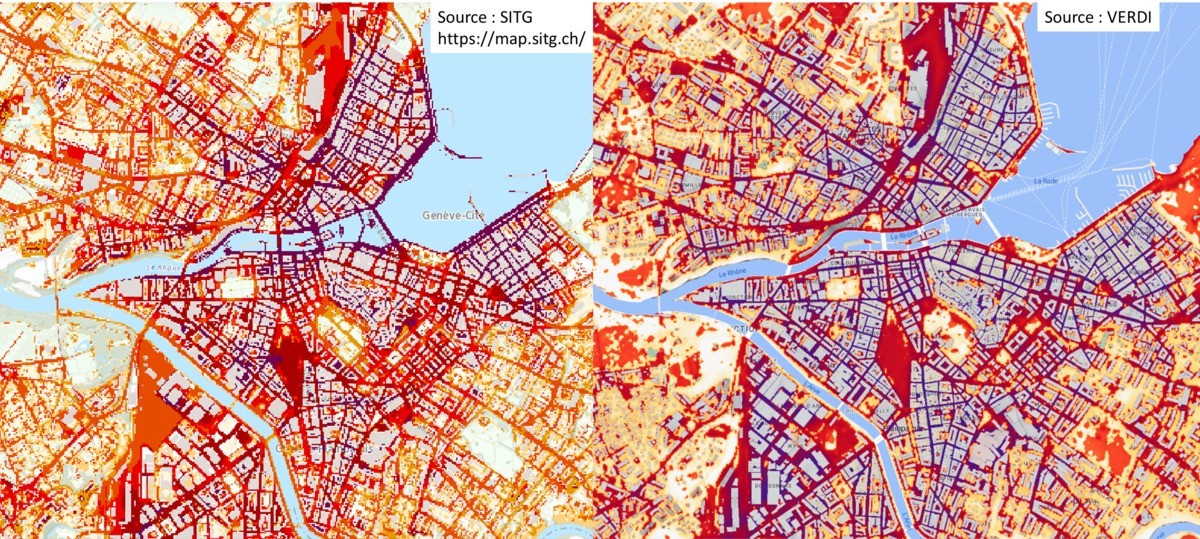
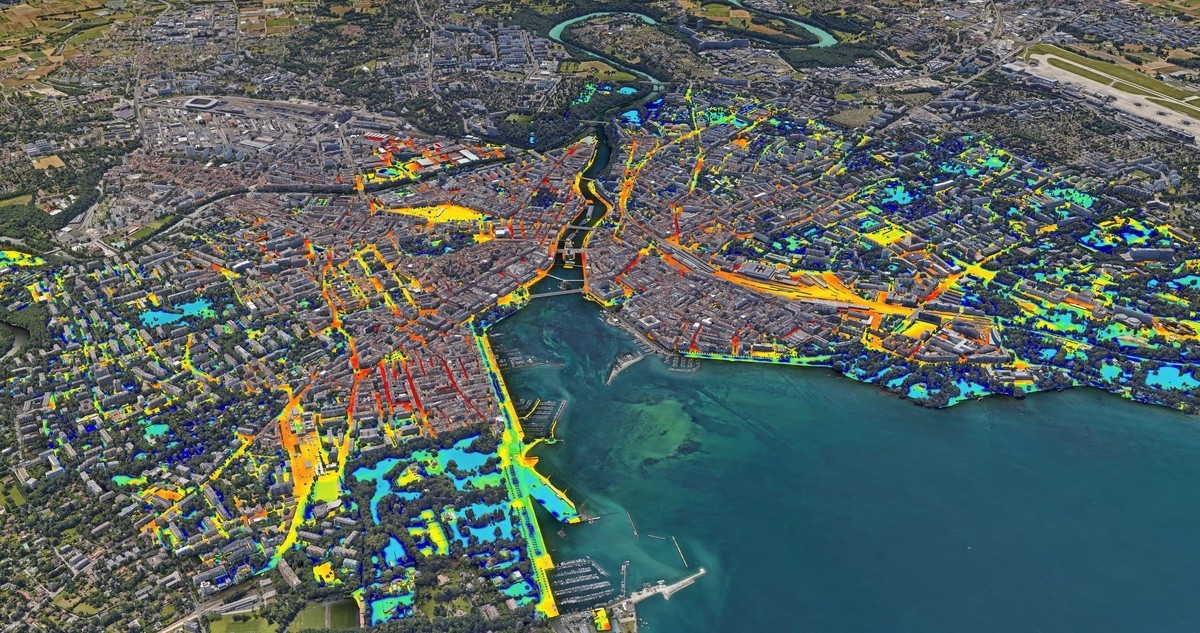
The following image presents a 3D view of the territory of Geneva.
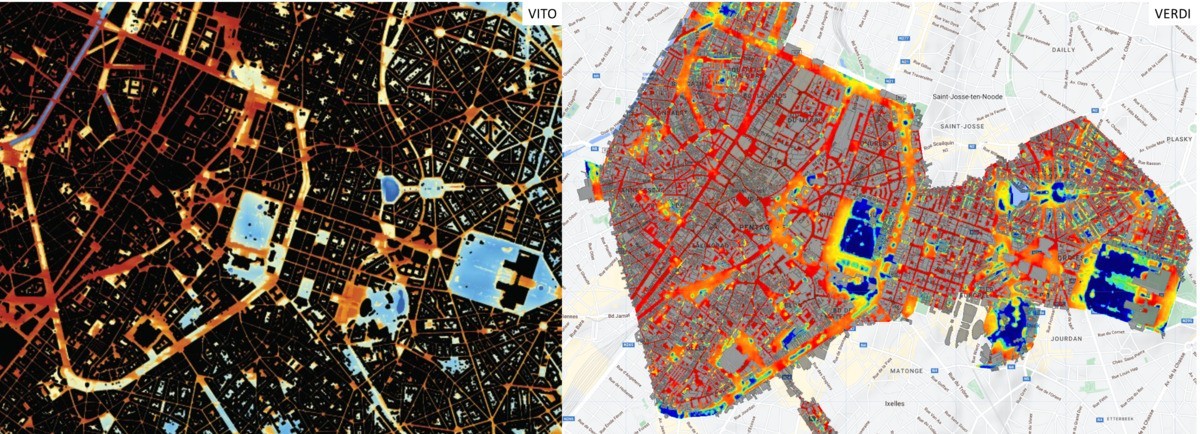
Brussels:
The city of Brussels and the VITO laboratory presents a microclimate study here. The following images shows a comparison of the two approaches to the heart of the city of Brussels:
Montreal:
The results based on our User Comfort Index are compared with those of a thermal imagery available on https://ici.radio-canada.ca/nouvelles/special/2016/6/carte-chaleur/map.html.
If the trends are similar, the differences deal with the spatial definition, the absence of buildings in our case (the UHI is calculated on public area) and the date, since we are using summer data here. 2021 (summer 2022 being too unfavourable for the impact of vegetation).
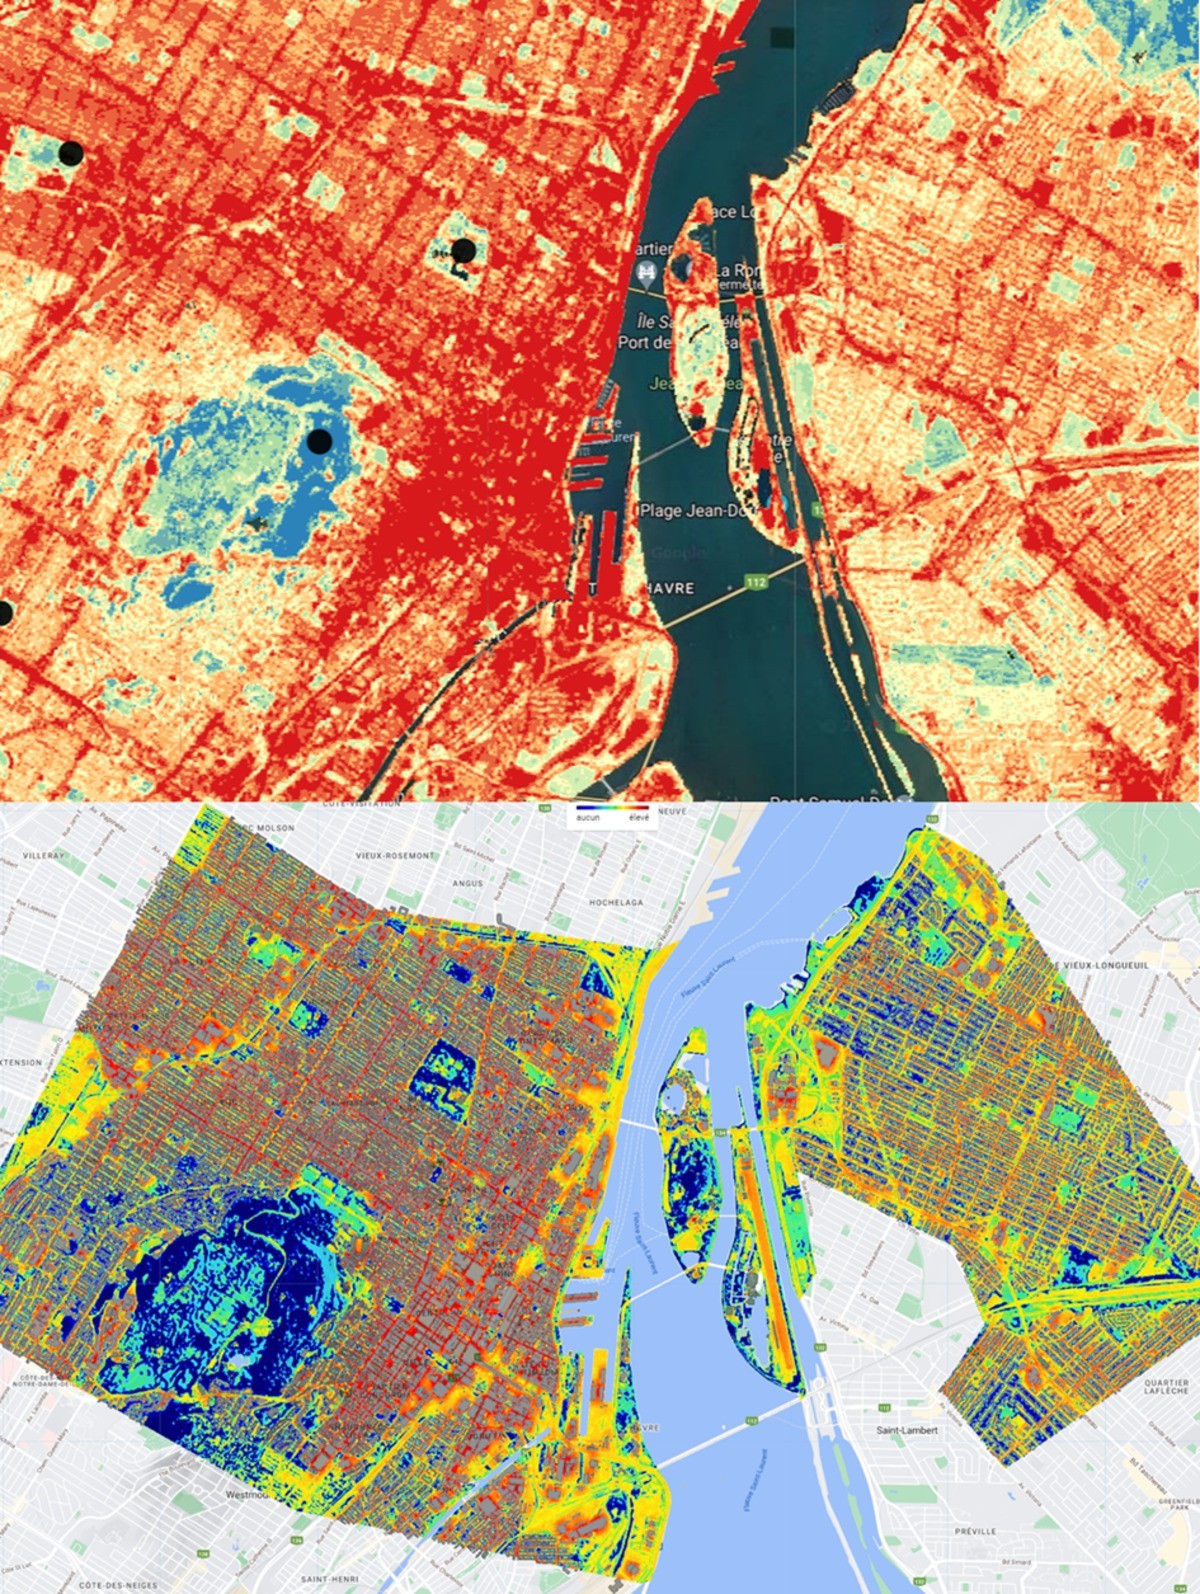
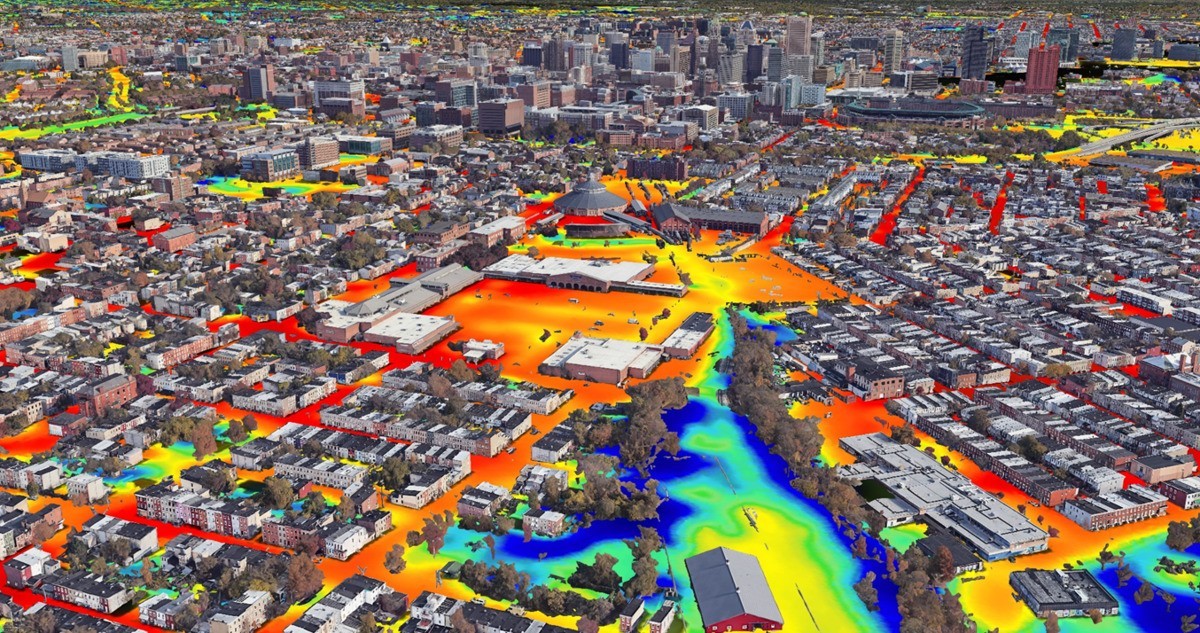
The following figure presents a 3D view which, if it is of less interest in terms of analysis, clearly highlights the role of vegetation.
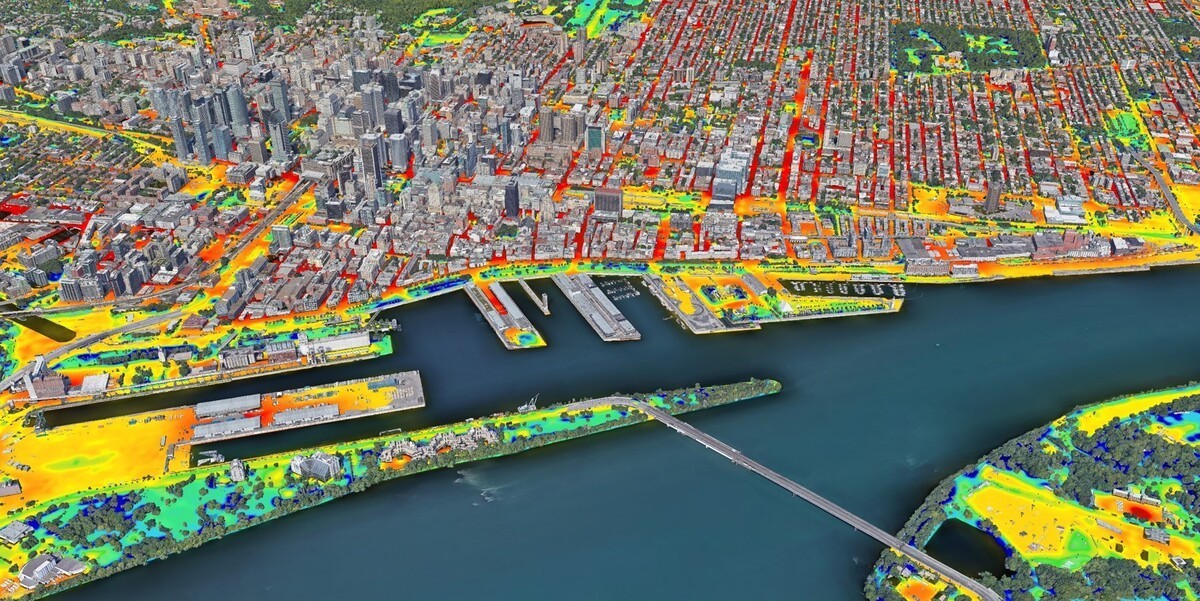
Baltimore:
Still on the American continent, we worked on the case of Baltimore, for which we carried out a summary comparison with a thermography imaging, available on Baltimore Office of Sustainability.
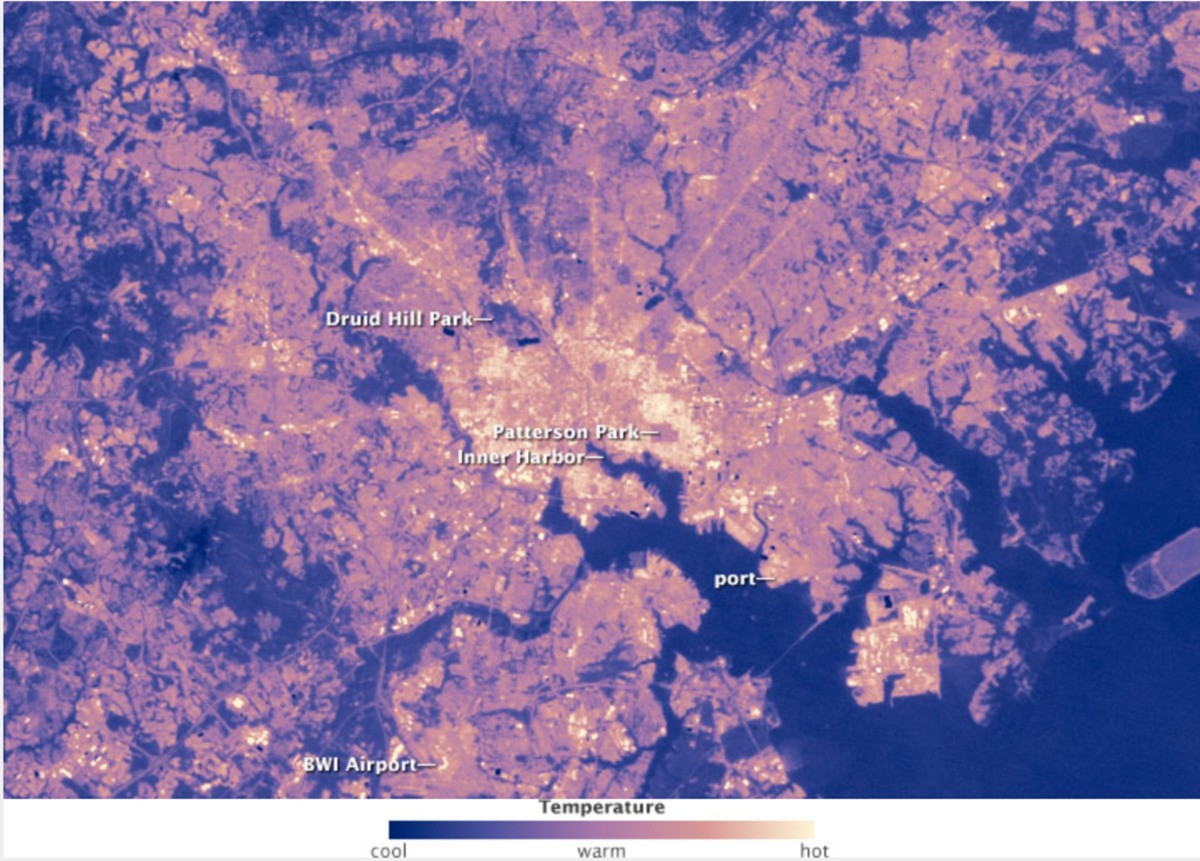
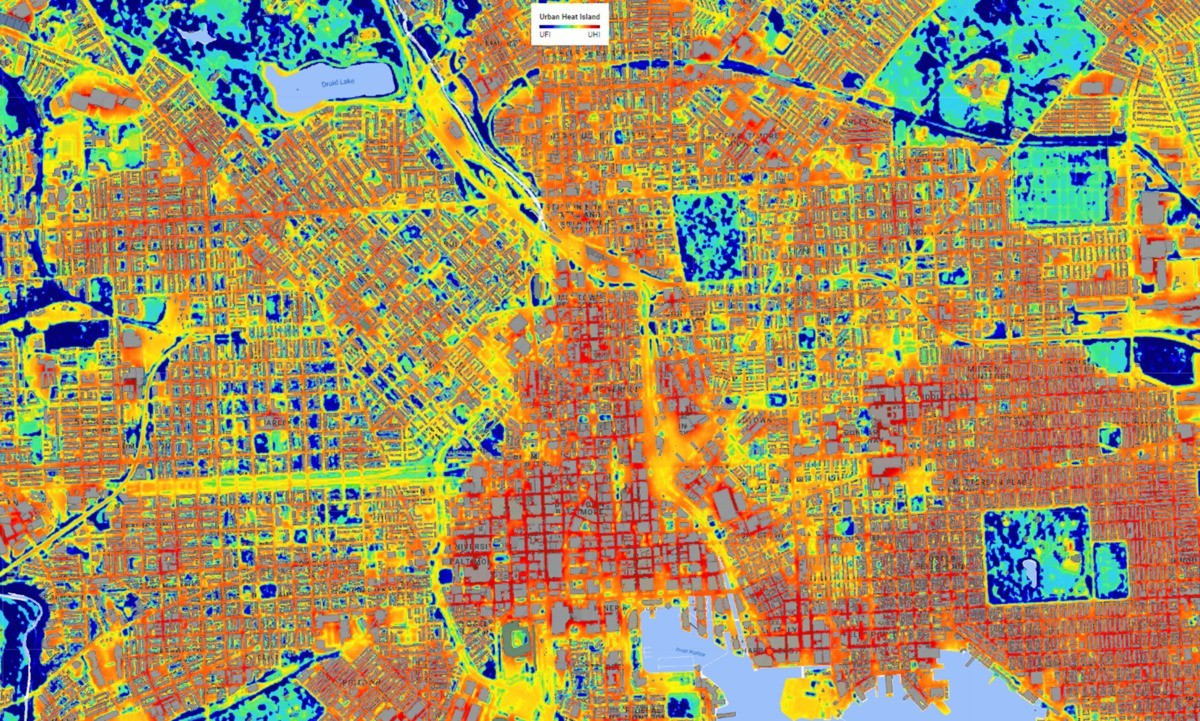
This image shows the UHI map on the city of Baltimore.
Conclusion and perspectives
For all the cases above, the comparison of the analysis need to be refined, but the first results show a good correlation of the results obtained with User Comfort Index with those of the various usual methods. T
he comparison with thermography imaging remains limited since we take into account more information relating to the storage and dissipation capacities of thermal energy.
This study also shows the ability of the approach to deal with any type of urban space in Europe or North America. If other territories are interested for sharing information, we will be pleased to go further on this research study (Eric Larrey).