

Built Environment: measuring climate change impact
One of the main reasons for global warming is the sustained increase of CO2 emissions, trapping heat and warming up the atmosphere. With more frequent storms, landslides or floodings, climate change will make buildings more vulnerable and reduce their lifespan. As energy plays a key role in the management of buildings, in this article, we will discuss the consequences of climate change and increased CO2 emissions on the building's energy consumption and occupant comfort. For the following calculations, we will use Building Energy Modelling (BEM) to evaluate how an office building will behave in the near (2050) and distant future (2100) compared to the year it was designed (2000).
As you might know, Dexma uses BEM for many purposes such as simulating the impact of energy efficiency retrofits, estimating the disaggregation of energy consumptions, or evaluating the impact of different scenarios.
Measuring the impact of climate change on buildings: external factors
To represent the effect of climate change on buildings, we will focus on the following significant weather parameters for the built environment:
- Atmospheric CO2 concentration in PPM
- Outdoor Air Temperature in ºC
- Outdoor Air Relative Humidity in %
The effect of other meteorological parameters like wind speed, solar radiation or rainfall has been neglected whether due to the lack of literature or due to the estimated low effect on the building behaviour.
Let’s now look at these three parameters, their definition and their impact on the building’s performance.
1. Atmospheric CO2 concentration
The atmospheric CO2 concentration is expressed in Parts Per Million (PPM) and fluctuated between 200 and 300 ppm in the past centuries.
Based on the OECD Environmental Outlook Baseline projections, the current atmospheric CO2 concentration has been around 400 ppm since the 2000s, reaching a new threshold. Atmospheric CO2 concentration is predicted to continue rising up to reach 530 ppm by 2050, and 780 ppm by 2100.
If we want to see these alarming numbers decrease, we are left with no choice but to significantly reduce our emissions. However, even if we were to stabilise our CO2 emissions, unfortunately, this would not be immediately noticeable. Indeed, it takes time for the CO2 emitted to be eliminated from the atmosphere naturally: whereas some cycles are fast and can eliminate CO2 in 5 years, the absorption of CO2 by the soil, the oceans or the vegetation can take thousands of years…
2. Outdoor Air Temperature
The Outdoor Air Temperature, or Dry Bulb Temperature, is basically the one we refer to when speaking about air temperature. It is called "Dry Bulb" because the air temperature is indicated by a thermometer not affected by the air moisture.
Based on the same OECD projections, the outdoor air temperature will compared to 2000, increase by 土 2ºC by 2050 and by 土 4ºC by 2100.
This temperature change affects us all. It is causing regional and seasonal temperature extremes while reducing snow cover and sea ice, increasing heavy precipitation and changing the range of plant and animal habitats - expanding some and reducing others.
“The Earth's temperature has risen by 0.08° Celsius (0.14° Fahrenheit) per decade since 1880, but the rate of warming since 1981 is more than twice that: 0.18° C (0.32° F) per decade”, as highlighted by this Climate.gov report.
3. Outdoor Air Relative Humidity
Relative humidity (RH) is a measure of how much water vapour is in a water-air mixture compared to the maximum amount possible. It is given as a percentage from 0% (absolutely dry air, zero moisture content) to 100% (air saturated with moisture, any additional moisture will condense). There are fewer studies concerning the relationship between outdoor air humidity and climate change, but the one from PNAS indicates a decrease in relative humidity of 0.2% per decade in the last 50 years (illustrated by graph C).
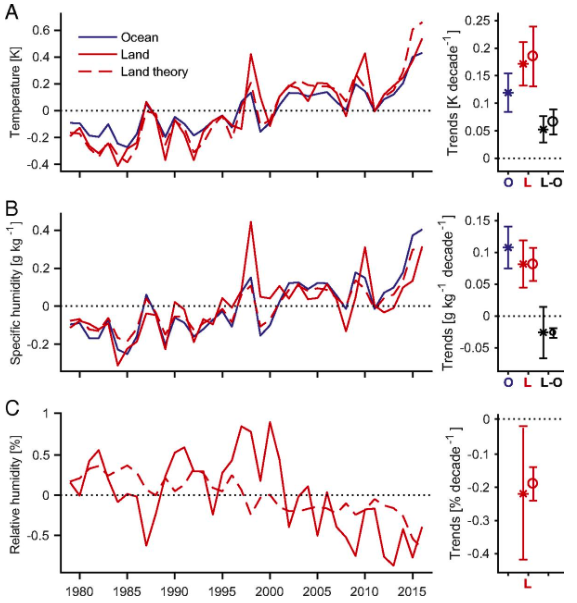
Combined with the increasing Outdoor Air Temperature (Graph A), the total amount of moisture (specific humidity) is in fact increasing as shown by Graph B. Study shows that this deadly combination of increasing heat and humidity could have many direct consequences on health, productivity and could even lead to death even for healthy individuals.
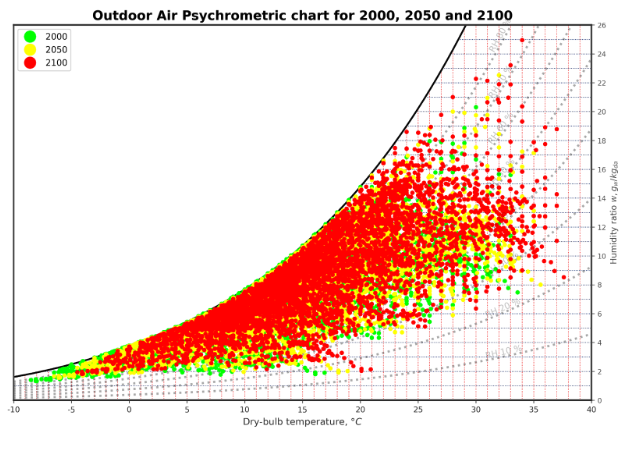
The resulting weather conditions can be summarised in the following psychrometric chart (see here for more information about psychrometric charts), showing the higher dry-bulb temperatures and humidity ratios.
What does it mean for your Buildings?
Well…that’s a good question!
Let’s now imagine an office building in Lyon in France, a temperate region of Europe, built in the 2000s. We will assume a 3-storey building with a heat pump for the heating, and a chiller for the cooling, with a building envelope corresponding to the standards of the year 2000. Thanks to Dexma’s BEM tool you will be able to estimate the impact of climate change on the building thanks to different indicators (IAQ, thermal comfort, indoor air temperature and humidity, HVAC energy consumption), and for 3 different climate scenarios we mentioned: the years 2000, 2050 and 2100.
Impact on Occupant Comfort
>>> Read the entire article here
Editor’s note – This article has been written by a leading expert in energy management software:
 Johann Loux, Building Energy Modelling & Data Scientist Engineer, part of the Dexma Detect team since 2021. His objective is to improve Dexma's AI algorithms through automated energy modelling of buildings. He also brings his expertise in the field of energy efficiency to the development of Dexma's products.